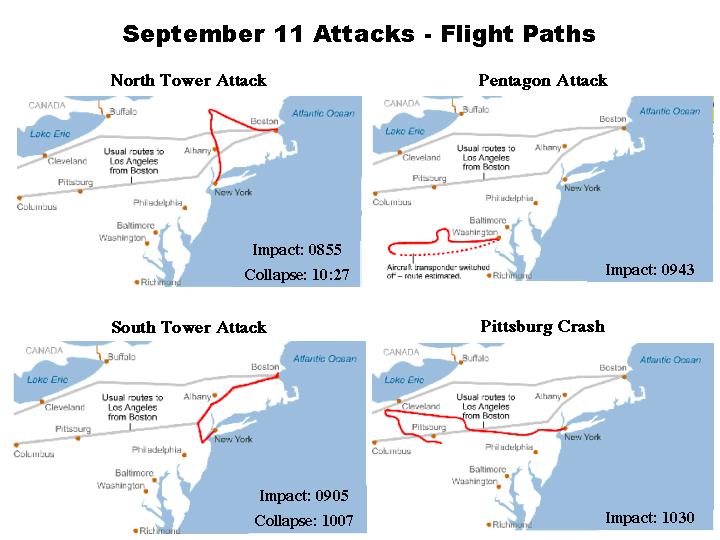
Afghanistan, the Taliban, and al-Qa'idaFlight paths of the four airliners hijacked on September 11, 2001. Simple facts about Afghanistan: Land area - 647,500 sq. km (250,000 sq. mi.) or about 95% the size of Texas. Highest point - Nowshak 7,485 m (24,577 ft.) or about 4,250 ft. higher than Mt. McKinley. Afghanistan, showing ethnic mix by major language group. The Taliban are primarily Pashtun Afghanistan, areas under Taliban control Major Ethnic Groups in Pakistan, showing the spill-over of these groups into Iran, India, and Afghanistan "Pashtunistan," majority Pashtu-speaking areas in and near Afghanistan Military Operations in Urban Terrain (MOUT) Afghanistan Page. Although Afghanistan is a country the size of Texas with mountains higher than the Alps, it also has several sizable cities - Kabul, Qandahar, and Herat. Peshawar, just over the border in Pakistan is home to well over 2 million, many of them pro-Taliban and al-Qa'ida. The Greater Threat: Missile or Terrorist Bomb?The statement was recently made that no truck bomb ever killed US soldiers in a war. Is this true? Here is the data. Since 1983, for every US service member killed by an enemy ballistic missile, more than 16 have been killed by terrorist bombs. Defense Death SpiralChuck Spinney's 70 chart briefing on why equipment is aging and readiness suffers, even though we're outspending the rest of the world. Provides data to illustrate the three interlocking arms of the spiral: A modernization program that even if executed perfectly (i.e., no overruns or stretch outs) cannot modernize our forces, a declining readiness posture that is costing increasingly more money, and an unauditable set of Pentagon books that cannot provide the data needed to fix the first two problems. Weapon System Costs"Program Costs to Date for Selected Weapons Systems" compiled by Christopher Hellman at the Center for Defense Information. The Fifteen Power StandardNEW! The Fifteen Power Standard. The FY2002 DoD Budget Amendment exceeds the combined defense budgets of the next fifteen largest spenders. NEW! Spending by the US and likely allies exceeds all possible "threats" by roughly a factor of 6. The "Four Percent Solution"Recently, several commentators have called for increasing US defense spending to an arbitrary percentage of gross domestic product (GDP). The charts in this section show the implications relative both to historical US defense budgets and to what the rest of the world spends. For further information, please refer to Comment 381.
Spending TrendsRising Cost of Low Readiness
Fourth Generation Warfare
|