![]()
Return to Defense Charts and Data
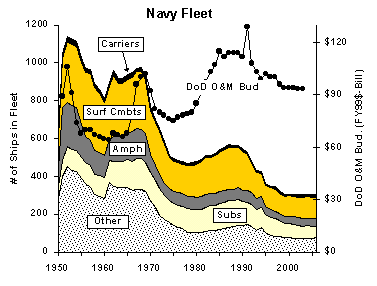
1. Since the end of World War II, the number of ships has fluctuated, but generally gone down (left scale). Conversely, the operations & maintenance (O&M) budget has trended upwards (right scale), reflecting the increasing complexity of ship designs. Note that although both inventory and O&M budgets have decreased since the height of the Reagan build-up in the late 1980s, the number of ships has declined faster than the operations and maintenance budget. The net effect of these changes has been a marked increase in per unit O&M costs.

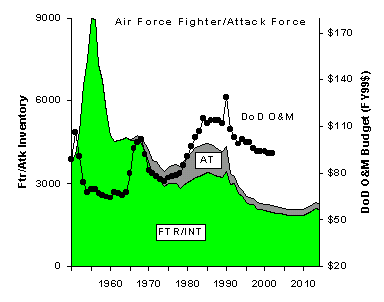
2. The situation in the Air Force mirrors that of the Navy, with numbers (left scale) decreasing faster than O&M budgets (right scale). Again, the root cause is the increase in complexity marking each new generation of fighter aircraft (with minor exceptions such as the A-10 failing to offset the main fighter progression: F-100 to F-4 to F-15).

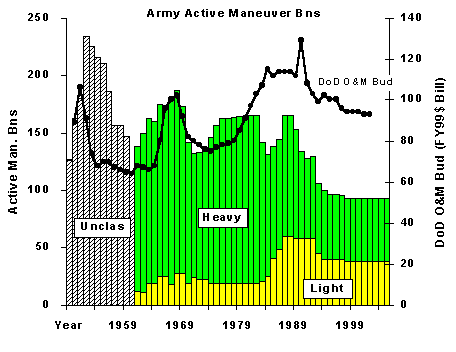
3. Finally, the Army presents the same pattern, with forces generally declining, while O&M budgets have actually trended upward over the time period shown.

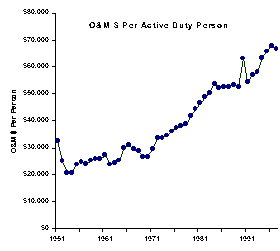
4. When aggregated DoD-wide, the trends noted above lead to an interesting conclusion: since its bottom in the early 1960s, O&M spending compared to force size (as measured by number of active duty personnel) has more than tripled. This is a direct result of a forty-year policy of structuring smaller and smaller forces consisting of ever more complex weapon systems.

Return to Defense Charts and Data